Joerg Meyer, Ph.D.
Computer Graphics, Biomedical Imaging,Spatial Computing, AR/VR/MR
Email: joerg.meyer01@gmail.com
|
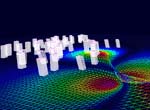
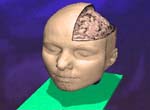
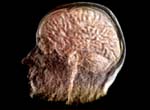
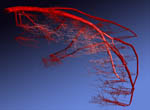
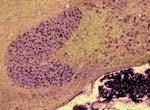
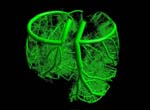
Research focusThe goal of Dr. Meyer's research is the development of fundamental methods and algorithms for interactive rendering, large-scale data manipulation, processing, transmission, and visualization, and visual communication through real-time, scientific visualization. On a broader level, the purpose of this research is to improve simulation software (enhance earthquake preparedness; provide better scenario simulation software for the emergency management agencies), and to develop improved, medical diagnostic tools for next-generation health care. In the field of Earthquake Simulation, a software suite has been developed that enables the simulation of various earthquake scenarios on a three-dimensional map with variable-height buildings that represent typical structures in urban areas. In the field of Biomedical Imaging, two human organs have been studied in greater detail: the brain and the heart. The development of a brain atlas under the Human Brain Project (NIMH) aims at a better understanding of brain structures from a macroscopic to a microscopic scale. Structural changes on the cellular level can be compared against a reference atlas and are expected to yield new insights in the development of detrimental diseases, such as Schizophrenia and Alzheimer's. A second biomedical project aims at a better understanding of the underlying causes of coronary vascular disease (CVD) in the human heart. Topological features, such as vessel diameters and angles, need to be measured with high accuracy and confidence. A supplemental computational model describes the statistical distribution of the smaller vessels, including the capillaries, which cannot be captured using current CT scanning technology. The highly complex, tree-shaped geometry of the coronary vascular system provided new challenges for hidden surface removal and backface culling, where traditional algorithms failed or were not very efficient. The close collaboration with the Medical Center in Orange and the development of our novel, hard- and software-based rendering method is expected to accelerate the statistical analysis of such complex tree structures significantly. This will ultimately lead to better diagnosis and treatment options for CVD patients. ProjectsFundamental Research. Fundamental components of my research include 3-D wavelet-based data compression, storage and transmission algorithms that make use of a transformation from the spatial domain into the frequency domain. Efficient space subdivision schemes, such as Quadtree and Octree structures, have been combined with wavelets in order to facilitate fast and efficient access to an entire volumetric data set, or to arbitrary subsets of a volume, at multiple levels of detail.(1) Multi-resolution Data Representations for Biomedical Imaging. Multiple levels of detail are necessary when a data set, such as a medical scan of an organ, is supposed to be displayed either on a desktop display, on a handheld device, such as a MicroPC, or on a large display wall. A coarse resolution of the rendering is usually sufficient to obtain information about position and orientation of the object on the screen. With only a small percentage of the original data, this preview image can be generated and rendered in 3-D instantly, even if the data is sent over a low-bandwidth network link, such as a phone line or wireless network. When the image is refined, only differential data is streamed over the network and added to the internal data representation, allowing for a re-rendered image at higher resolution. The motivation for developing the underlying data structures and rendering methods was mainly the fact that most modern imaging devices and medical scanners output their data in a cross-sectional slice format, which is not suitable for multi-level-of-detail rendering. The developed compression, transmission and storage methods are inherently lossless, but they can be made lossy, leading to significantly higher compression ratios without noticeable differences in the visualization. 2-D image and 3-D volumetric data compression using wavelets is superior to current JPEG or TIFF (LZW) compression as it achieves higher compression ratios and fewer artifacts. Therefore, it is currently being introduced as an industry standard for 2-D image and video compression (JPEG2000, MPEG-4). (2) Automated Biomedical Image Alignment. Sets of thin histological sections, as they are typically generated by microtomes or cryostats, often lack the precise alignment that is crucial for 3-D volume reconstruction. We have developed automated image alignment techniques based on contour detection, Bzier curve representations of contours, pinhole detection, feature extraction, histogram equalization, and mutual information, employing both linear and non-linear image transformations. Our strategy for handling image resolutions that exceed typical screen sizes was to determine the alignment coordinates and non-linear deformation parameters on a smaller scale and then apply these to the large image, followed by a micro-tuning alignment step. This way we ensured cell membrane size precision in our image alignment. Although the alignment is not always perfect in all regions due to distortions present in the slicing process, the overall results were sufficient to align 1,400 slices of a Rhesus Macaque Monkey Brain (see below) in a semi-automated process in preparation for 3-D rendering. (3) Multi-Modal Image Registration. Various imaging modalities are currently available, such as Computed Tomography (CT) or Magnetic Resonance Imaging (MRI). Depending on medical indications, one of several possible scanning method is selected. While CT uses ionizing radiation to produce high-quality images of bone structures, MRI, which uses strong magnetic fields, is usually used to scan soft tissues, such as the brain. In some cases, it is necessary to obtain both CT and MRI scans (or other combinations of existing imaging modalities). Besides the cost factor, alignment of the scanned specimen after scanning is a common problem. While different resolutions and scanning angles or directions can be easily compensated for using affine transformations, the problem with image alignment lies in the way two different modalities depict tissue types. An X-ray absorption histogram of a CT scan is very different from the proton density histogram of an MRI scan. In other words: One shows bone shadows, while the other shows water content. Although both modalities produce computed cross-sections that are typically represented as grayscale images, the gray levels represent very different physical quantities. We were able to demonstrate that standard image alignment algorithms based on mutual information cannot be precise, because not only the object representation is different, but also the gradients (feature outlines). As an extension of the previous work, a novel image registration technique for multi-modal biomedical scans, such as CT and MRI, has been developed. This method is based on histogram permutation, which allows us to correlate tissue types instead of non-matching gray value gradients. Our method has also been shown to be faster and more efficient to compute than standard methods based on mutual information. (4) Tetrahedral Mesh Decimation. In addition to the previous research thread, alternative data structures and algorithms for other types of grids and meshes have been developed. In addition to regular volumetric grids with implicit structures, other irregular grids, such as tetrahedral meshes have been studied. One of the main accomplishments during the review period was the development of a novel tetrahedral mesh decimation algorithm called TetFusion, which facilitates significant reduction of tetrahedral meshes (down to less than 10% of their original size) while preserving topological features and certain boundary conditions. An extension of this method called QTetFusion employs quad metrics to preserve the volume of a mesh. We tested this algorithm on various standard data sets and found that in many cases our method is superior to other edge-collapse- or point-collapse-based algorithms. In a single atomic step, an entire tetrahedron can be reduced to a single point, and all its affected neighbors can be adjusted to match the new mesh. Applications. Rendering of large-scale, slice-based, volumetric biomedical image data is similar to large-scale rendering of layered soil models. Therefore, the same visualization techniques that were originally developed for biomedical imaging purposes could also be applied to civil engineering applications, such as earthquake simulations. (1) Earthquake Simulation. In collaboration with Pittsburgh Supercomputer Center and the Civil and Environmental Engineering (CEE) Department at UC Berkeley, we applied the TetFusion and QTetFusion algorithms to a finite element ground motion simulation, which resulted in real-time play-back capability of a large-scale earthquake simulation. A building simulation was added to study the response of tall structures to various real (recorded) and simulated earthquakes. Due to our combined, hybrid rendering methods, it was possible for the Civil Engineering researchers to see for the first time the progression of a shock wave during an earthquake along a fault line, and the structural response of buildings of different height in a simultaneous visualization. According to the Federal Emergency Management Agency FEMA, which was present during presentations for this NSF-funded project, this research may lead to enhanced earthquake preparedness. To facilitate this, a software suite has been developed that enables the simulation of various earthquake scenarios on a three-dimensional map with variable-height buildings that represent typical structures in urban areas. This software suite is available for download and on a CD-ROM. (2) Biomedical Imaging. In the field of Biomedical Imaging, in the application domain two human organs have been studied in greater detail: the brain and the heart. Various scanning techniques from multiple species have been used, and visualization and digital image processing techniques have been specifically developed to handle data sets greater than normal harddisk capacity (for instance, 76 GB and higher for a single scan of a Rhesus Macaque Monkey Brain). (2a) Rhesus Macaque Monkey Brain Atlas. The development of a brain atlas (funded by the National Institute of Mental Health, NIMH, as part of the Human Brain Project) is aimed at a better understanding of brain structures from a macroscopic to a microscopic scale. Structural changes on the cellular level, as they occur in detrimental brain diseases such as Schizophrenia and Alzheimers, can be compared to a reference atlas, which includes a three-dimensional model of the entire brain on a cellular level. The main accomplishment is the development of data structures that enable instant access to arbitrary levels of detail in a very large data set (multiple gigabytes). In the given example, 1,400 cross-sectional histology images (5,000 x 4,000 pixels each) were obtained at a resolution of 2,666 dpi (dots per inch). This is equivalent to a pixel spacing of approx. 9m (for comparison: a typical brain cell is about 20-150m in diameter). Non-standard 3-D wavelet decomposition combined with octree space subdivision has enabled quasi real-time access to this enormous data set. Only a high-resolution display wall, such as the 200 megapixel HIPerWall at Calit2, is capable of displaying these images in their native resolution. (2b) Protein Visualization. Large-scale biomedical data sets of macromolecular structures such as DNA and proteins describe highly complex biomolecular entities which often consist of thousands of atoms and residues in large 3D strands of amino acids. Comparative visualization of various structures in any type of abstract representation is helpful for understanding the relation between function and structure, and prediction of properties of newly discovered proteins which might have an impact on drug design and treatment options for diseases. Various types of abstract representations can be used to display these data sets, ranging from traditional ball-and-stick models to feature-presenting cartoon models. Despite these abstractions, even the most simplified representations still generate a large amount of geometry data, and useful features are often difficult to discern in the large amount of geometric detail produced by the rendering software. In order to address the complexity issue, we developed a Virtual Reality display system to process large amounts of geometry data for real-time 3D exploration, superimposition, and interactive navigational tasks in a virtual reality environment. The system has been tested and demonstrated to provide valuable insights in 3-D protein structures in an immersive, stereoscopic display environment and on a large, 200 megapixel tiled display wall (HIPerWall). (2c) Visualization of Phylogenetic Trees. Phylogenetic trees depict the hierarchical pattern of common ancestry of species, genes, sequences or other entities (taxa). Phylogenies have become a widely and routinely used tool in the biological and biomedical sciences, especially in the analysis of molecular sequence variation. In order to study phylogenies and to explore their predictive properties, large-scale tree databases have been created using various formats. At the same time, work is advancing on the synthesis of extremely large phylogenetic trees from these large-scale databases of smaller trees. The quality of diagnostic predictions strongly depends on the completeness of a set of samples of a particular group of organisms or genes, and the correctness of the connectivity information between the taxa. Therefore it is essential to have precise navigation and visualization tools to interact with the tree structure and the structure of relationships between trees. We developed a framework for interactive visualization of large phylogenetic trees, which is designed to facilitate rendering of the enormously large data sets now available. Hierarchical data storage and new query techniques are used to access the data. Tree data is transmitted over the Internet using progressive schemes. The user is provided with several visualization, navigation, and query options, ranging from global views down to detailed views of single trees or taxa, or comparative side-by-side and superimposed representations. Intuitive visualization paradigms, such as stick models, funnels, magnifying lenses, icons for clusters, etc., are used to present the user with a comprehensive user interface to navigate the trees. (2d) Cardiovascular System Visualization. Another biomedical project is focused on cardiovascular research and is aimed at a better understanding of the underlying causes of coronary vascular disease (CVD) in the human heart. Certain sections of blood vessels are more prone than others to the development of plaques and calcium deposits. In order to characterize these sections, topological features, such as vessel diameters and angles, need to be measured or modeled with high accuracy and confidence. Initially, we scanned a cast of a pigs heart that was filled with a contrast agent using the CT scanner at the UCI Medical Center in Orange. While vessel diameters of approximately 1mm or larger in a human heart or in a pig model can be scanned using a regular CT scanner (0.6mm), and while smaller vessels can be seen in a MicroCT scan of a mouse heart we obtained from a different source (about 50m per pixel), the capillary vessels still cannot be seen very well. In order to obtain a complete model of the coronary vessel tree that is valid on all scales, we developed in collaboration with Ghassan Kassabs group in the BME Department at UCI a supplemental computational model that describes the statistical distribution of the smaller vessels, including the capillaries, which cannot be captured using current CT scanning technology. This hybrid model was then visualized in real-time using a 16-node Sun computing cluster. It is important to note that the number of large-scale vessels is in the order of tens to hundreds, while the number of capillary vessels is in the order of millions. Special algorithms had to be developed to handle the large amount of geometry data generated from this model. Subsequently, we developed methods to render the 20 million vessel segments and the resulting geometry data on a regular desktop PC. The highly complex, tree-shaped geometry of the coronary vascular system provided significant challenges for hidden surface removal and backface culling, and traditional algorithms failed or were not very efficient. Therefore, we developed new, view-based hidden surface removal and backface culling techniques using OpenGL hardware and software features to accomplish this enormous rendering task. Using this new method, it was possible to generate an interactive display of all three branches of the cardiovascular tree which can be zoomed, rotated, and translated without any significant delay. Our close collaboration with the UCI Medical Center in Orange was very helpful in this endeavor. The development of a novel, hard- and software-based rendering method now accelerates the statistical analysis of such complex tree structures significantly. We expect that such models will ultimately lead to better diagnosis and treatment options for CVD patients, as outlined in the corresponding NIH grant proposal that funded the work of a shared post-doctoral researcher. As part of our outreach program, a modified version of the visualization software with a different user interface for a K-5 audience was shown as an interactive exhibit at the Discovery Science Center, Santa Ana, CA, February 11-22, 2005. (2e) Cancer Detection in Hamster Cheeks using OCT. In a joint project with Dr. Petra Wilder-Smith from the Beckman Laser Institute, novel algorithms for interpreting images obtained from a non-invasive laser scanning technique called Optical Coherence Tomography (OCT) have been developed to detect oral malignancies. The advantage of the scanning method is that no tissue needs to be destroyed for the scanning (in-vivo imaging). The images from the scanning device were processed, visualized, interpreted and then compared to traditional histopathology. Two- and three-dimensional visualization has been used to analyze the tissue scans. Oral cancer accounts for about 8% of all malignant growths. It occurs in the tissues of the lips, the tongue, on the floor of the mouth, on the cheek lining, on the gums or on the palate. Most oral cancers look very similar under a microscope and are called squamous cell carcinomas. These are malignant and tend to spread rapidly. Smoking and other tobacco use are associated with 70-80% of oral cancer cases. Smoke and heat from cigarettes, cigars, and pipes irritate the mucous membranes of the mouth. Heavy alcohol use is another high-risk activity associated with oral cancer. For this study, we used images obtained from Optical Coherence Tomography (OCT) scanning devices at the Beckman Laser Institute (BLI). After initial image processing, which includes contrast enhancement and flattening of the image, a segmentation algorithm based on a frequency analysis of the image (Wavelet transform) was applied to distinguish benign from malign tissue. Cancer cells are characterized by chaotic growth, increased tissue density and higher degree of vascularization. This is expressed in a frequency-transformed image. Similar to a Fourier analysis, in a Wavelet transformation the image is decomposed into its frequency spectrum. The advantage of the Wavelet decomposition over a Fourier transform is the localization of the frequency components, i.e., the preservation of both spatial and frequency information. By analyzing the low- and high-frequency components on multiple scales, it is possible to obtain information about the tissue composition in a specific area of the sample. The image analysis has been conducted on various scales. The resolution of OCT is high enough to enable analyses both on a cellular level as well as on an architectural level. The wavelet algorithm breaks down the analysis on these two levels further into smaller sub-levels. Multiple frequency levels are needed on each scale to obtain information about the tissue composition. This data is all contained in the same OCT image (dual-level multi-resolution analysis). We are currently working on correlating OCT scans with histology sections of the same animal. Similar alignment techniques as the ones developed for other histology sections (Rhesus Macaque Monkey Brain) will be employed. After this alignment step, a hybrid 3-D visualization of OCT and histology will reveal correlations between the two scans one being an invasive, the other a non-invasive technique. (2f) Stem Cell Tracking. Stem cells have the potential to differentiate into many different cell types. In this pilot study, we were able to track the fate of injected stem cells (oligodendrocyte progenitor cells) in a rat spinal cord injury site. In an animal experiment, which was conducted by Dr. Hans Keirstead at the UC Irvine Stem Cell Research Center, some of the neural function of the spinal cord could be restored, enabling the rat to move its legs and walk again. Demyelination, the loss of the myelin sheath that insulates axons, is a prominent feature in many neurological disorders including multiple sclerosis and spinal cord injury and it results in the disruption of signals within the axons. The myelin sheath can be replaced by a process called remyelination, in which endogenous oligodendrocyte progenitor cells are recruited to an area of demyelination and differentiate into mature oligodendrocytes that wrap myelin around the demyelinated axons. Remyelination, however, does not reach completion in animal models of spinal cord injury. Therapies are being developed to either enhance the amount of endogenous remyelination, or to enhance the amount of remyelination with cellular transplant. It is important to quantify the amount of remyelination that is attributable to such therapies so as to appreciate their effectiveness in addressing the issues of demyelination at the cellular level. We have developed a new technique to automatically identify the remyelinated axons based on iso-contour analysis of the image at progressively increasing intensity levels. This axon identification scheme is shape independent and makes use of the variational property of the intensities of the cell structures in the cross-sectional microscopic images of stained spinal cords. The images show a mixture of normally myelinated axons, and remyelinated cells that differ in their relative shapes and myelin sheath thickness around them. We employ specifically designed geometric algorithms to clean up the identified axons and to analyze their structure in order to recognize the oligodendrocyte-remyelinated axons. The results of this algorithm for automatic identification, classification, and counting of remyelinated axons were corroborated by extensive cross-verification by the domain experts in the Stem Cell Research Center at UC Irvine. |
|
Links Back to homepage Back to homepage Back to previous page Back to previous page
|